
HTTP body logging for Azure Monitor OpenTelemetry
I recently published a small NuGet package: Runnel.AzureMonitor.RequestLogging. It logs ASP.NET Core HTTP request and response bodies to Application Insights as custom dimensions on request telemetry and is built for the modern Azure Monitor OpenTelemetry distro (Azure.Monitor.OpenTelemetry.AspNetCore).
Why
Whenever a user reported an issue, we needed the actual HTTP requests and responses to debug it. We use Application Insights for our monitoring, but by default, it doesn’t collect the request and response bodies (for good reason). We looked at the built-in HTTP logging in ASP.NET Core when it came out in .NET 6, but it logged more than what we needed. All we really wanted was to look at a request in Application Insights and see what the request and response bodies were, without searching the logs. We wanted it to redact sensitive information, and only log the bodies when it was applicable. In other words, on 4xx or 5xx responses and on HTTP verbs that have bodies, like POST, PUT, and PATCH.
Matthias Guentert’s Azureblue.ApplicationInsights.RequestLogging had solved exactly that problem for us. But it only works with the classic Application Insights SDK, so Microsoft’s move to OpenTelemetry left us without it. After looking around and finding no replacement, I built Runnel.AzureMonitor.RequestLogging. It’s an independent project inspired by his work, with an intentionally identical options model, so that migrating takes minutes.
What it does
- Logs request & response bodies as
customDimensionson request telemetry - Logs selectively by HTTP verb, response status code, and content type
- Truncates captured bodies at a configurable length
- Redacts sensitive values (passwords, tokens, credit card numbers, etc.) by property name or regex
- Preserves the client IP address without modifying your Application Insights resource
- Optionally captures request bodies even when downstream code throws
Quickstart
using Azure.Monitor.OpenTelemetry.AspNetCore;
var builder = WebApplication.CreateBuilder(args);
builder.Services.AddOpenTelemetry().UseAzureMonitor();builder.Services.AddHttpBodyLogging();
var app = builder.Build();
app.UseHttpBodyLogging();   // early in the pipeline, before endpoints
app.MapPost("/orders", (Order order) =>    order.Fail        ? Results.BadRequest(new { error = "Order rejected", order })        : Results.Ok(order));
app.Run();
internal sealed record Order(string Item, int Quantity, bool Fail, string? Password);
With the defaults, the bodies of POST/PUT/PATCH requests that end in a 4xx or 5xx response are captured. In the example, posting an order with fail: true captures both bodies, while a successful one is left alone. From there you can query the results straight from Log Analytics:
requests| where isnotempty(customDimensions.RequestBody)| project timestamp, name, resultCode, requestBody = customDimensions.RequestBody, responseBody = customDimensions.ResponseBody, clientIp = customDimensions.ClientIpA matching row looks like this — both bodies are there, with sensitive properties already masked:
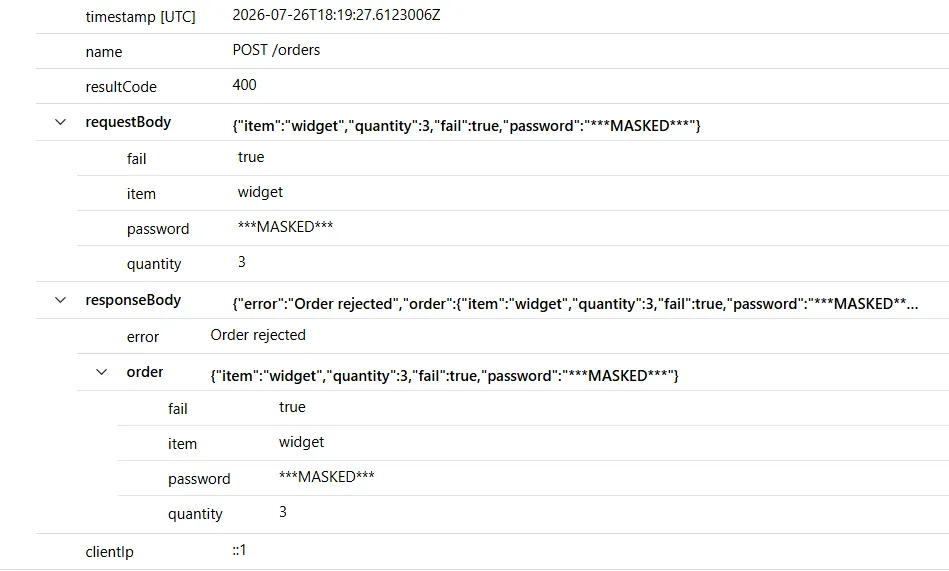
Note that clientIp is only populated if you set DisableIpMasking, since Application Insights masks the built-in client_IP field at ingestion. The other columns come through on the defaults.
Configuring it
Every knob lives on BodyLoggerOptions, passed to AddHttpBodyLogging:
builder.Services.AddHttpBodyLogging(o =>{ o.MaxBytes = 10_000; // default: 1000 characters o.ExcludedContentTypes.Add("multipart/form-data"); // skip file uploads o.PropertyNamesWithSensitiveData.Add("ssn"); // on top of the built-in list o.DisableIpMasking = true; // keep the client IP as a custom dimension o.EnableBodyLoggingOnExceptions = true;});Options are validated at startup, so an invalid regex or an empty tag key fails when the app boots with a descriptive OptionsValidationException, rather than on the first request that trips it.
You can widen the net past the defaults: o.HttpVerbs.Add(HttpMethods.Get) and o.HttpCodes.AddRange(StatusCodeRanges.Status2xx) will capture successful reads too. Weigh that against the cost: every request matching HttpVerbs has its response buffered in memory until the pipeline completes, whether or not the status code ends up qualifying.
If the built-in behavior doesn’t fit, ISensitiveDataFilter, IBodyReader, and IActivityTagWriter are all registered with TryAdd*, so registering your own implementation first takes precedence.
How it works
The middleware buffers the request and response streams and writes the captured (redacted, truncated) bodies as tags on the incoming request Activity, which is the span ASP.NET Core creates for each request. The Azure Monitor OpenTelemetry exporter emits unrecognized activity tags as customDimensions on the corresponding requests record, which is exactly where the classic SDK put them.
A few things worth knowing before adopting it:
- An OpenTelemetry exporter must be configured. Without a listener there’s no
Activityto tag, so the captured bodies are dropped. Note that the middleware still buffers and redacts them first regardless, so you pay the cost either way. Any exporter works, not just Azure Monitor, but that’s what I’ve tested with. - Sampling applies. If a request is sampled out, its span goes with it, body tags included. Worth remembering when the one request you’re hunting for isn’t there.
- Pipeline order matters. Register
UseHttpBodyLogging()early, before endpoints and before response compression, or you’ll log compressed bytes. - Responses are buffered in memory for every request matching
HttpVerbs, so don’t route streaming endpoints (SSE, large downloads) through the middleware. Exclude them by verb, or branch the pipeline withapp.UseWhen(...); there’s no path filter in the options. - A telemetry failure never fails the request. If capturing, redacting, or tag-writing throws, the middleware logs a warning and the response is delivered normally. Two deliberate exceptions: registering
UseHttpBodyLogging()twice throws immediately rather than silently swallowing the response, and on an already-aborted request the error propagates instead of being caught.
A word of caution
Writing HTTP bodies to Application Insights can reveal sensitive data that would otherwise stay protected in transit via TLS. The built-in redaction (PropertyNamesWithSensitiveData, SensitiveDataRegexes) is best-effort. You’re responsible for reviewing it against your own payloads and compliance requirements before enabling this in production.
Try it
dotnet add package Runnel.AzureMonitor.RequestLoggingdotnet add package Azure.Monitor.OpenTelemetry.AspNetCoreIt targets .NET 10 (ASP.NET Core 10). The README covers the full options table, migration guide from the classic-SDK package, and a runnable sample. It’s on NuGet under Apache-2.0.
Let me know how it goes for you if you use it! I’ve recently released v1.0 and it’s been working well for my own workloads.